RightMark Audio Analyzer test report
| Testing device | Realtek HD DELL |
| Sampling mode | 16-bit, 44 kHz |
| Interface | |
| Testing chain | External loopback (line-out - line-in) |
| RMAA Version | 6.4.2 |
| 20 Hz - 20 kHz filter | ON |
| Normalize amplitude | ON |
| Level change | 0.6 dB / 0.6 dB |
| Mono mode | ON |
| Calibration singal, Hz | 1000 |
| Polarity | inverted/inverted |
Summary
| Frequency response (from 40 Hz to 15 kHz), dB | +5.20, -21.56 |
Very poor |
| Noise level, dB (A) | -84.6 |
Good |
| Dynamic range, dB (A) | 79.0 |
Average |
| THD, % | 0.0041 |
Very good |
| THD + Noise, dB (A) | -74.4 |
Average |
| IMD + Noise, % | 0.035 |
Good |
| IMD at 10 kHz, % | 0.017 |
Very good |
| General performance | Average |
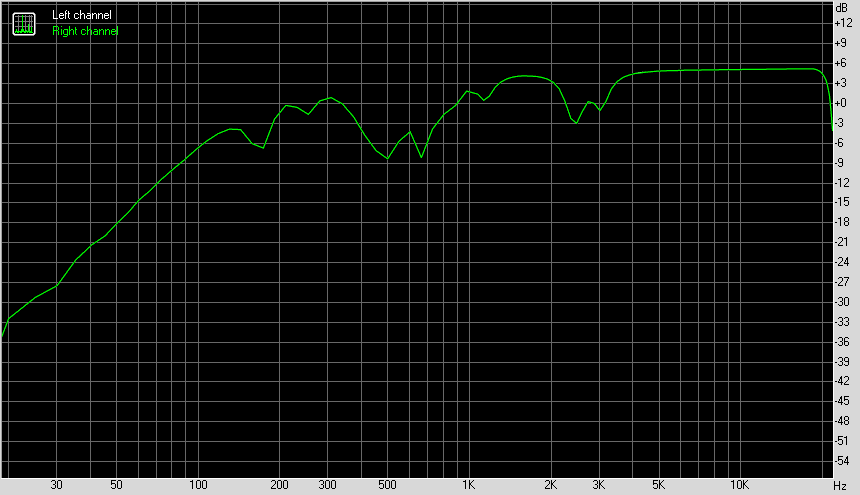
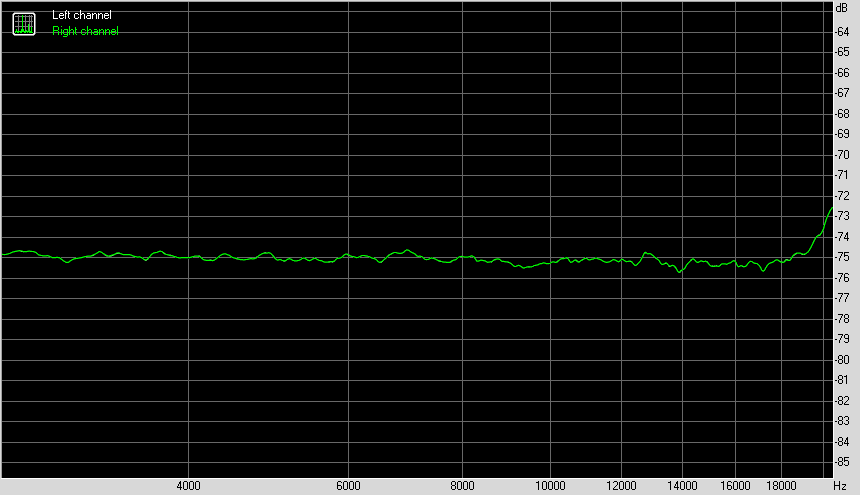
Frequency response
Left |
Right |
|
| From 20 Hz to 20 kHz, dB | -32.45, +5.24 |
-32.45, +5.24 |
| From 40 Hz to 15 kHz, dB | -21.56, +5.20 |
-21.56, +5.20 |
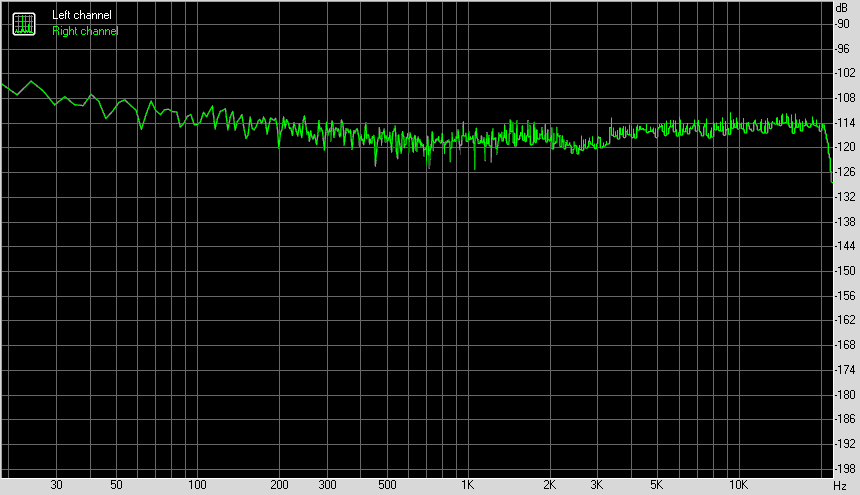
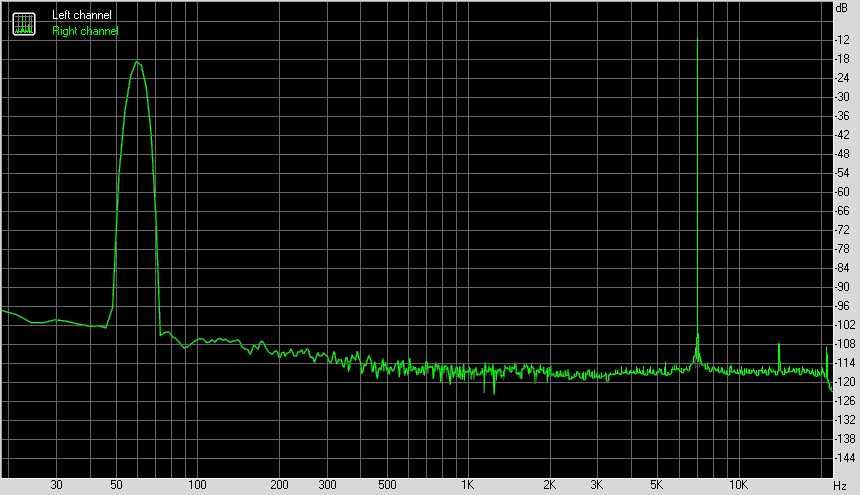
Noise level
Left |
Right |
|
| RMS power, dB | -83.2 |
-83.2 |
| RMS power (A-weighted), dB | -84.6 |
-84.6 |
| Peak level, dB FS | -69.6 |
-69.6 |
| DC offset, % | +0.0 |
+0.0 |
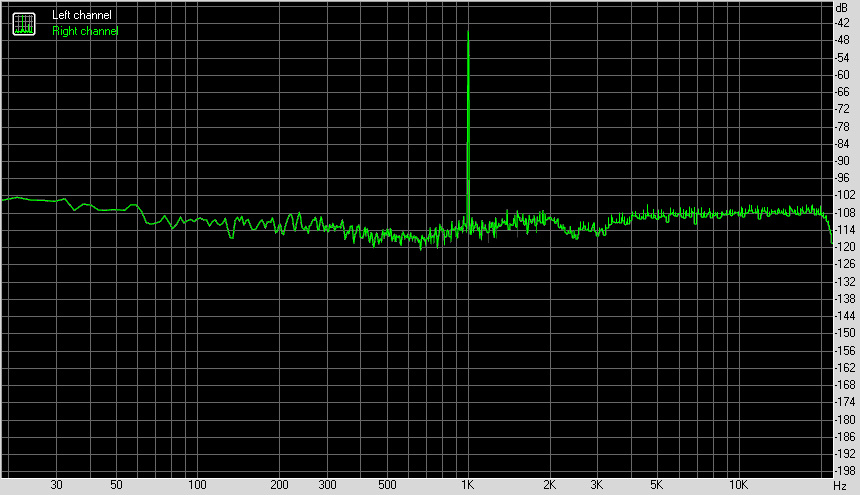
Dynamic range
Left |
Right |
|
| Dynamic range, dB | +77.6 |
+77.6 |
| Dynamic range (A-weighted), dB | +79.0 |
+79.0 |
| DC offset, % | -0.00 |
-0.00 |
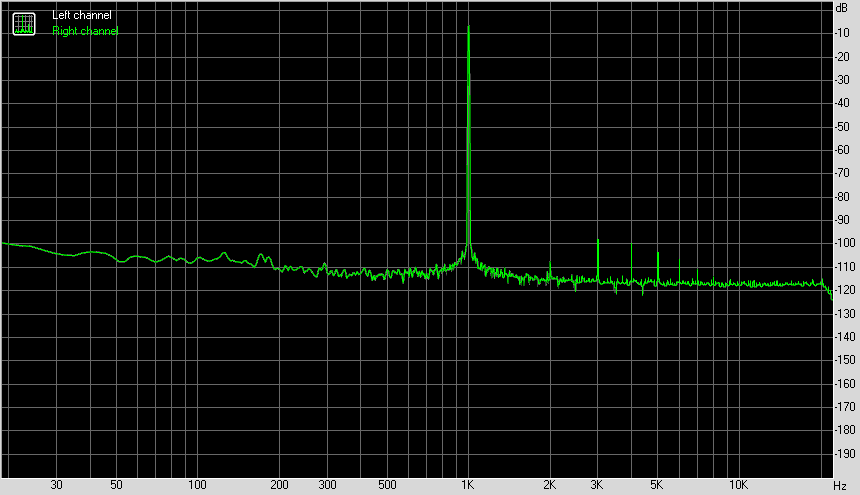
THD + Noise (at -3 dB FS)
Left |
Right |
|
| THD, % | +0.0041 |
+0.0041 |
| THD + Noise, % | +0.0199 |
+0.0199 |
| THD + Noise (A-weighted), % | +0.0190 |
+0.0190 |
Intermodulation distortion
Left |
Right |
|
| IMD + Noise, % | +0.0345 |
+0.0345 |
| IMD + Noise (A-weighted), % | +0.0294 |
+0.0294 |
IMD (swept tones)
Left |
Right |
|
| IMD + Noise at 5000 Hz, | 0.0176 |
0.0176 |
| IMD + Noise at 10000 Hz, | 0.0172 |
0.0172 |
| IMD + Noise at 15000 Hz, | 0.0171 |
0.0171 |