RightMark Audio Analyzer test report
| Testing device | E-MU 0404PCI E-MU ASIO |
| Sampling mode | 16-bit, 44 kHz |
| Interface | ASIO |
| Testing chain | External loopback (line-out - line-in) |
| RMAA Version | 6.4.2 |
| 20 Hz - 20 kHz filter | ON |
| Normalize amplitude | ON |
| Level change | -0.0 dB / -0.0 dB |
| Mono mode | ON |
| Calibration singal, Hz | 1000 |
| Polarity | correct/correct |
Summary
| Frequency response (from 40 Hz to 15 kHz), dB | +0.06, -0.06 |
Excellent |
| Noise level, dB (A) | -96.0 |
Excellent |
| Dynamic range, dB (A) | 96.4 |
Excellent |
| THD, % | 0.0011 |
Excellent |
| THD + Noise, dB (A) | -89.4 |
Good |
| IMD + Noise, % | 0.0043 |
Excellent |
| IMD at 10 kHz, % | 0.0051 |
Excellent |
| General performance | Excellent |
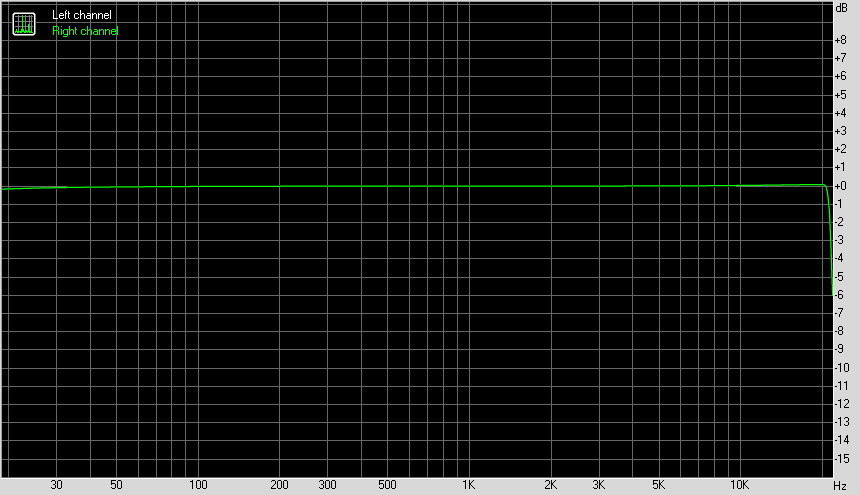
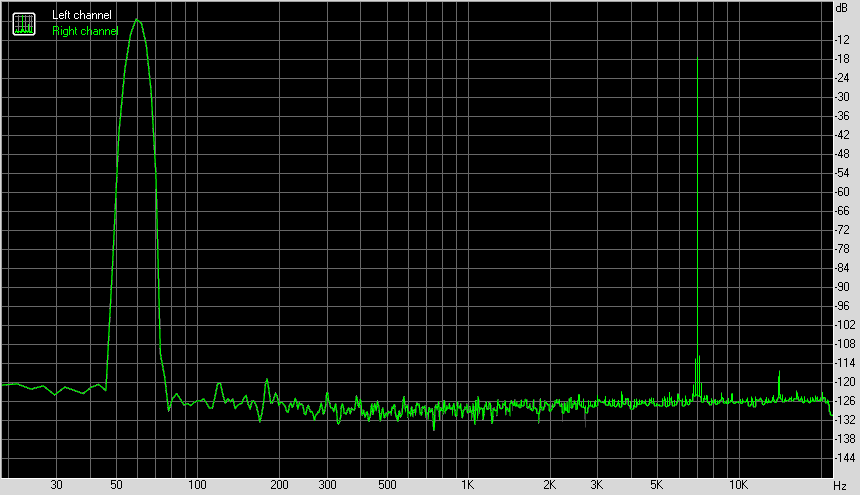
Frequency response
Left |
Right |
|
| From 20 Hz to 20 kHz, dB | -0.15, +0.08 |
-0.15, +0.08 |
| From 40 Hz to 15 kHz, dB | -0.06, +0.06 |
-0.06, +0.06 |
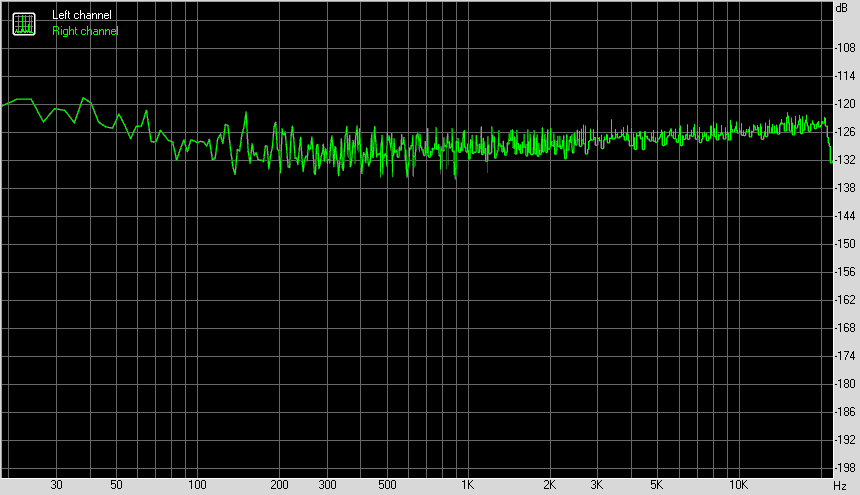
Noise level
Left |
Right |
|
| RMS power, dB | -94.6 |
-94.6 |
| RMS power (A-weighted), dB | -96.0 |
-96.0 |
| Peak level, dB FS | -82.4 |
-82.4 |
| DC offset, % | -0.0 |
-0.0 |
Dynamic range
Left |
Right |
|
| Dynamic range, dB | +95.5 |
+95.5 |
| Dynamic range (A-weighted), dB | +96.4 |
+96.4 |
| DC offset, % | -0.00 |
-0.00 |
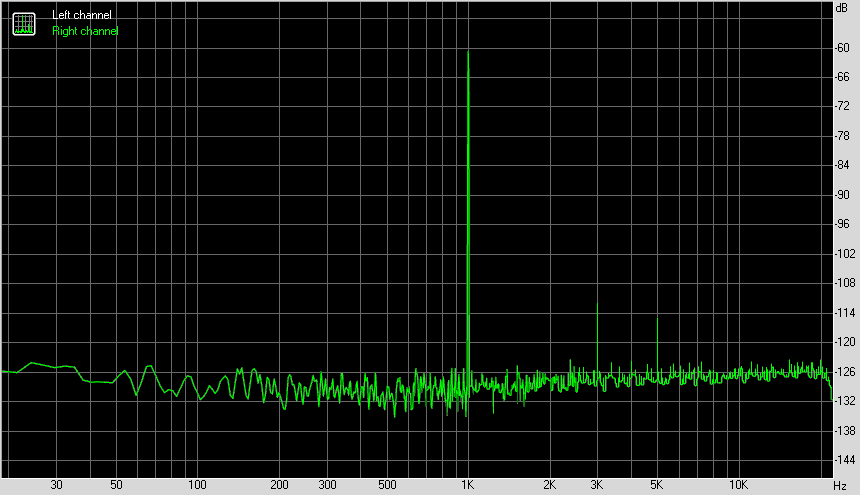
THD + Noise (at -3 dB FS)
Left |
Right |
|
| THD, % | +0.0011 |
+0.0011 |
| THD + Noise, % | +0.0036 |
+0.0036 |
| THD + Noise (A-weighted), % | +0.0034 |
+0.0034 |
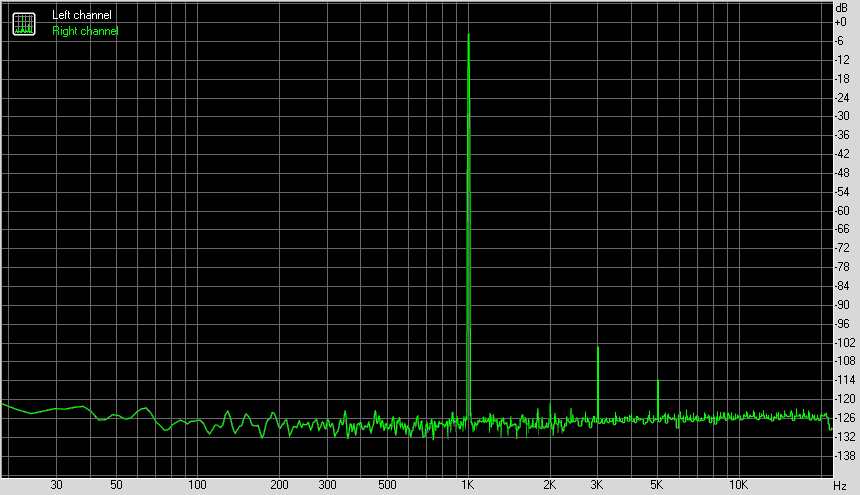
Intermodulation distortion
Left |
Right |
|
| IMD + Noise, % | +0.0043 |
+0.0043 |
| IMD + Noise (A-weighted), % | +0.0038 |
+0.0038 |
IMD (swept tones)
Left |
Right |
|
| IMD + Noise at 5000 Hz, | 0.0047 |
0.0047 |
| IMD + Noise at 10000 Hz, | 0.0049 |
0.0049 |
| IMD + Noise at 15000 Hz, | 0.0057 |
0.0057 |